Four types of approaches are being used for monitoring the health of the GBR.
Patterns over space and time
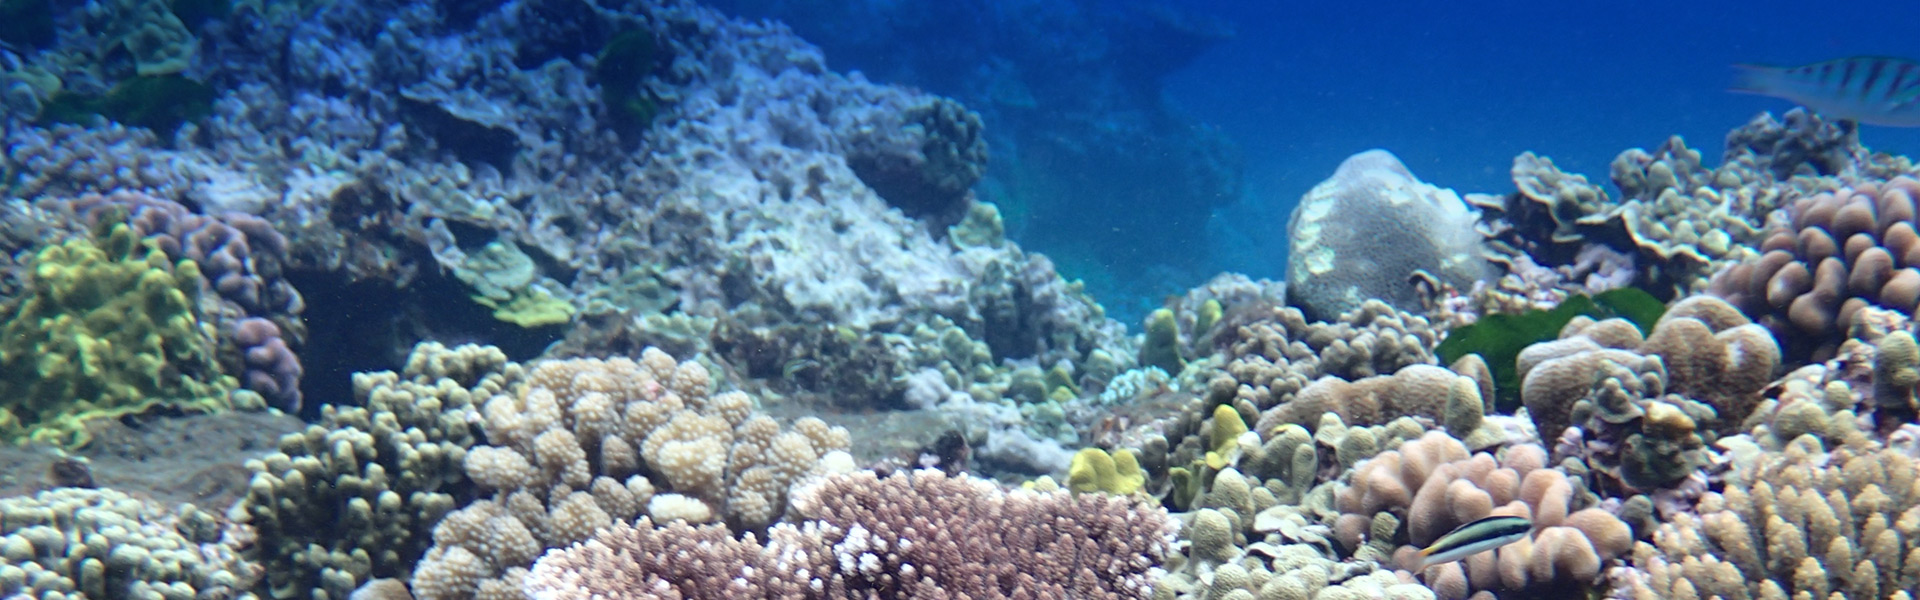
A major indicator of a healthy reef is the proportion of the area that is covered in coral (in contrast to algae, sand, etc). We can take observations of coral cover in selected areas and create statistical models that can predict coral cover in other unobserved areas of the reef and trends in coral cover over time. We can use images donated by divers to estimate coral cover at many more sites and time periods, which will lead to much better understanding and prediction of the health of the GBR over the whole region and over time.

Monitoring trends
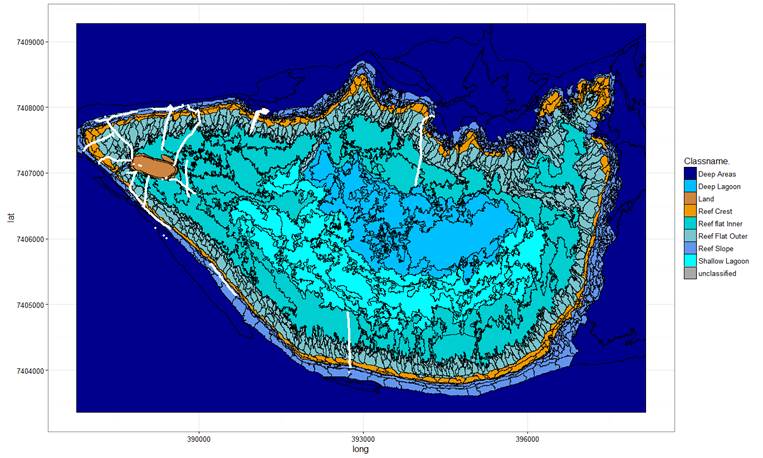
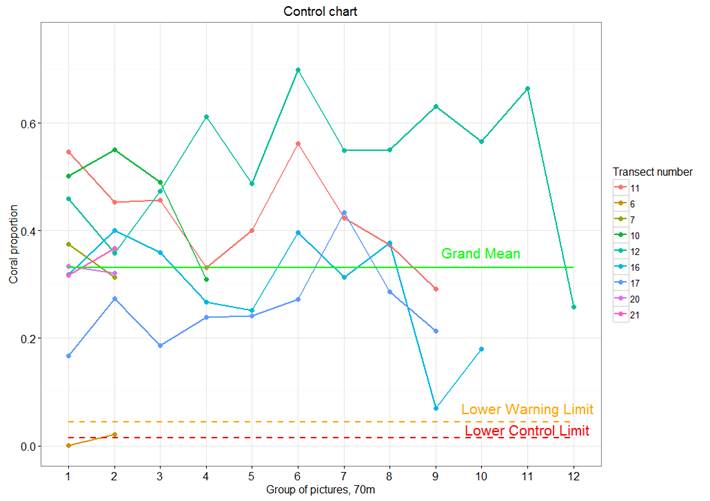
We can also focus on smaller areas of the GBR, for example particular islands. We can combine data and information from divers’ images to determine ‘normal patterns’ for different habitat areas, then monitor these regions to check for ‘abnormal behaviour’ or ‘improving or adverse trends’.

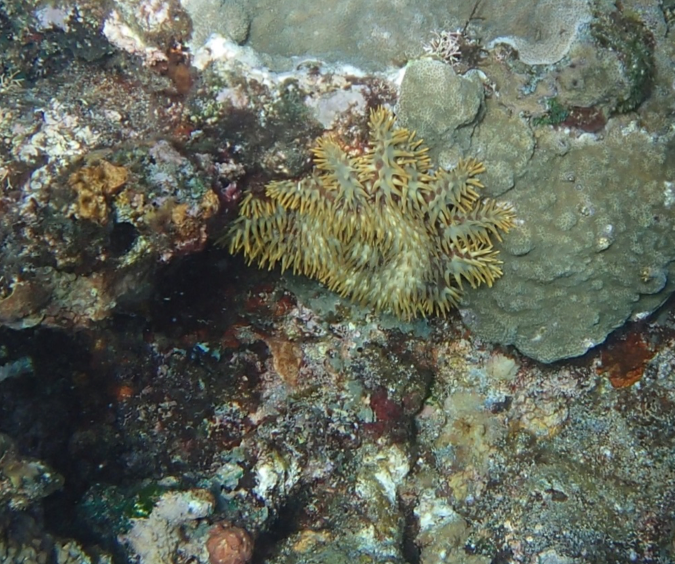
Mapping threats
We can use divers’ photos to identify important threats to the GBR, such as cyclone damage, bleaching events and crown of thorns. These can be ‘geo-located’ on the digital reef, so that patterns of occurrences and trends over time can be visually assessed.